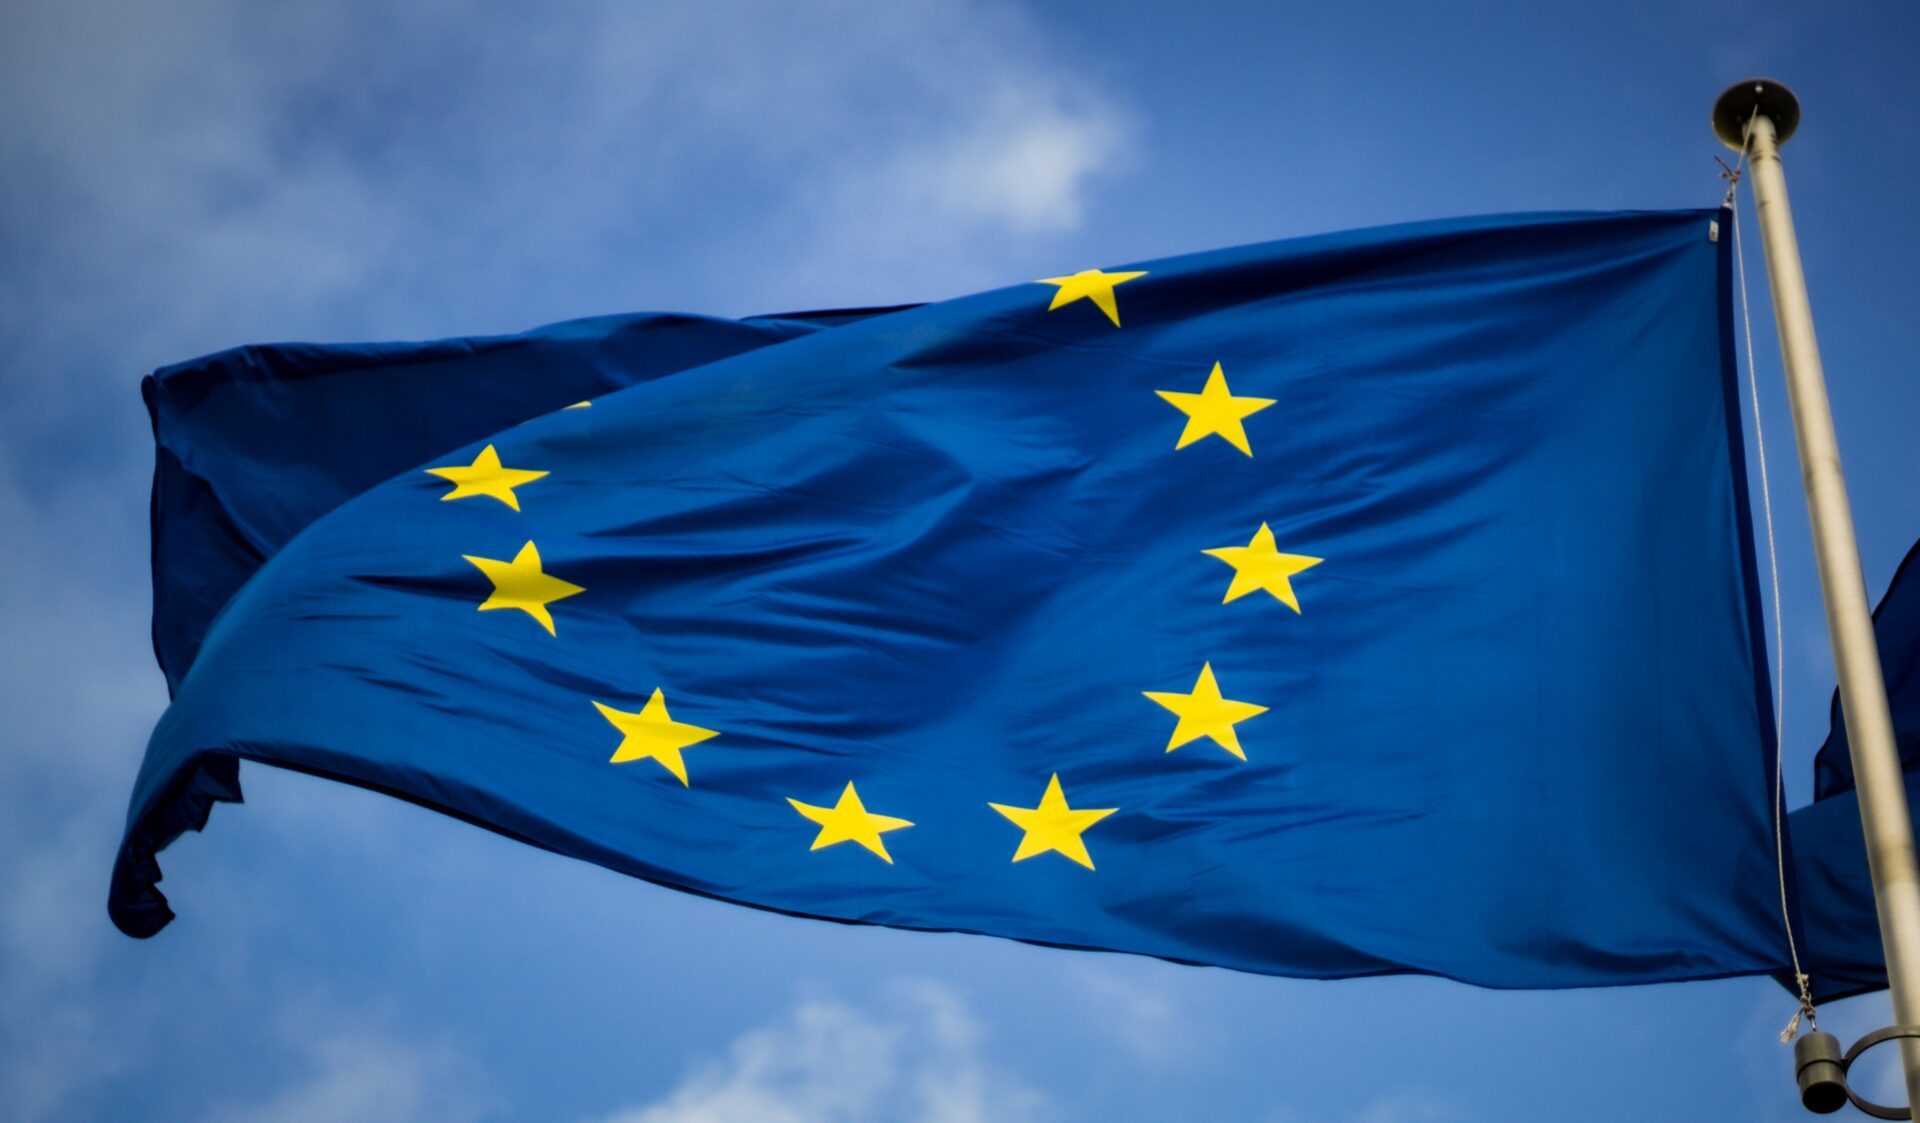
Those who identify with Europe
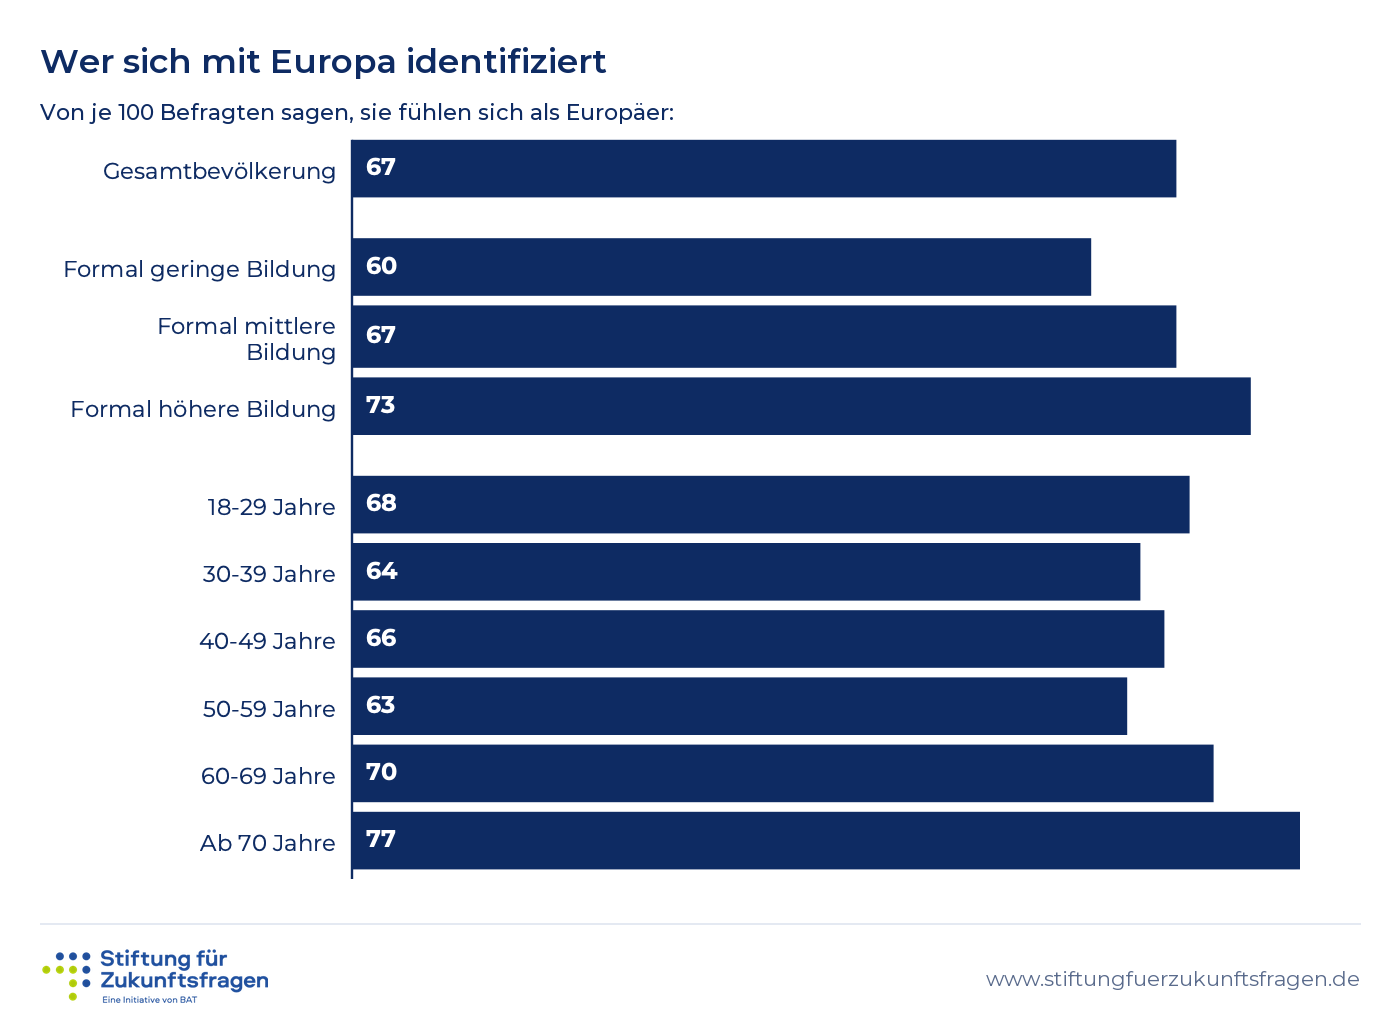
Out of every 100 respondents, they say they feel European:
Data as table
| Total population | 67 |
| low level of formal education | 60 |
| Formal secondary education | 67 |
| Formal higher education | 73 |
| 18-29 years | 68 |
| 30-39 years | 64 |
| 40-49 years | 66 |
| 50-59 years | 63 |
| 60-69 years | 70 |
| Ages 70 and up | 77 |
Download chart:PNG